


Q1 Map It Out: Geolocation
What in the... "Geolocation"!
Your class adventure is starting to take shape and now that you have a firm understanding of the roller coaster database, let's explore which amusement parks are close enough to visit while staying within budget.
Step 1. Close Enough
- Use the compass needle (geolocation tracker), “What’s Nearby” link in the top navigation bar to search for amusement parks by distance using Geolocation.
- You may get a pop-up that says, "rcbd.com wants to ... know your location. Select Allow this time.
- Read about the operating roller coasters at the amusement parks that are within the travel distance from your class trip budget discussed earlier.
What Works!
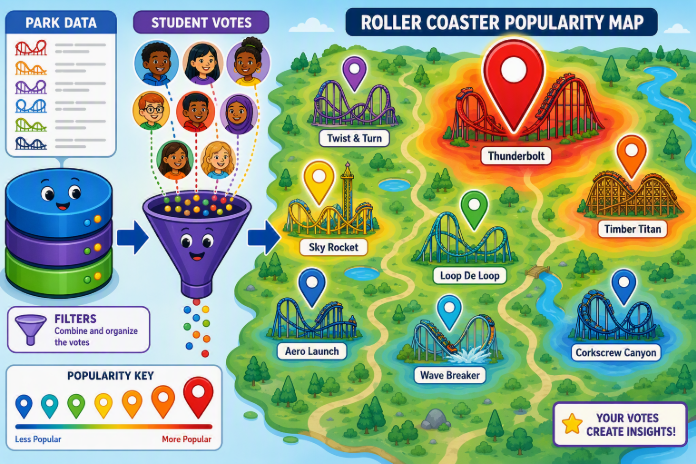
Now that you have an idea about what is nearby and have read about the options, let's narrow it down and create a visual to see the class options that are rising to the top, up to this point.
Step 2. Create a hotmap as a class of each person's ranked choices based on the facts and your individual interest.
- From all of the roller coasters that you read about in Step 1, determine how you would rank the Amusement Parks with a 5 being your favorite down to a 1 being your least favorite.
- Using the form that your teacher has shared, to enter your ranking.
- Your teacher will upload the rankings into a Google Map so that you are able to see the entire class rankings.
- Just be mindful that this may take some time. So, you may go onto Step 3, while your teacher is uploading the data.
Step 3. Reflect and Discuss. Read through the questions below. Formulate your own answers and then turn to a partner or small group to discuss your answers.
- How are databases useful?
- How was the ability to filter a database helpful?
- How else have you used filters to gather specific information (for example, searching for favorite types of songs or movies)?
- What other data visualizations have you used?
2.Q1 Student Checklist
 2.Q1 Student Checklist
2.Q1 Teacher Guide
 2.Q1 Teacher Guide
Competencies & Standards
MITECS Michigan Integrated Technology Competencies for Students, and
3. Knowledge Constructor
c. Students curate information from digital resources using a variety of tools and methods to create collections of artifacts that demonstrate meaningful connections or conclusions.
5. Computational Thinker
b. Students collect data or identify relevant data sets, use digital tools to analyze them and represent data in various ways to facilitate problem-solving and decision-making.
6. Creative Communicator
c. Students use digital tools to visually communicate complex ideas to others.
d. Students publish or present content that customizes the message and medium for their intended audiences.